Executive summary
Toronto’s housing markets did not move through the last decade together. In the regional resale series, the annual average home price rose sharply into 2022 and then fell for three consecutive years. The Toronto census metropolitan area’s average two-bedroom purpose-built apartment rent increased in every annual observation from 2016 to 2025. A separate archive of City of Toronto condominium leases shows a more abrupt rental cycle.
- Regional resale homes: the TRREB reporting-area annual average increased from $731,927 in 2016 to $1,067,741 in 2025: 45.9% nominal growth, or 14.0% after Toronto consumer-price inflation.
- Purpose-built apartments: Toronto CMA two-bedroom average monthly rent increased from $1,327 to $2,046: 54.2% nominal growth, or 20.4% after inflation.
- The clearest divergence came after 2022: regional annual home prices fell 10.6% through 2025, while the metropolitan purpose-built rent average rose 15.0%.
- The rental measure matters: the archived City of Toronto Q4 two-bedroom condominium lease average was $3,158 in 2025, below its archive-series peak of $3,415 in 2023.
These are distinct geographies, housing stocks and observation windows. Their trajectories can be placed alongside each other, but the differences are not a matched-property rent-versus-buy calculation. This paper presents original calculations from published aggregate data; it does not claim a new household survey, peer review or a causal experiment.
1. Research question and original contribution
The central question is how rent and purchase-price measures changed over the ten complete calendar years from 2016 through 2025, and how much of that change remains after adjusting for general consumer-price inflation. A second question is whether the decade’s endpoints conceal substantially different cycles.
The contribution is a reproducible comparison of three published housing series and a common inflation benchmark. We calculate rebased trajectories, compound growth rates, changes across three equal-length phases, inflation-adjusted changes, and dispersion in annual movements. We also preserve an archival condominium-rent series instead of silently presenting it as a fully revised history.
The tracker is a fixed research snapshot checked on 16 September 2026. Partial 2026 observations are excluded from the study period. The August 2026 TRREB report is used as the publication vintage for the regional historical sales series; using that later source does not extend the analysis into 2026.
Throughout the paper, “Toronto” is qualified where it matters. The City of Toronto is one municipality. The Toronto CMA is a metropolitan statistical area. TRREB’s reporting area is another regional market coverage. We do not treat the three as interchangeable boundaries.
2. Ten-year rent and housing-price tracker
The table retains the original dollars and observation periods. Home prices are annual averages across property types, purpose-built rents are October observations, and condominium rents are fourth-quarter lease averages. All dollar values are Canadian dollars. A monthly rent is a flow of housing expenditure; a purchase price is the price of an asset.
Select a year to inspect its levels. The complete table remains available for comparison and in the downloadable CSV. The condominium column uses each year’s archived report and should be read with the revision note in Section 9.
- Regional annual home price
- $1,067,741
- Toronto CMA 2BR monthly rent
- $2,046
- City Q4 condo rent, archive
- $3,158
| Year | TRREB regional home price Annual CAD | Toronto CMA 2BR rent October CAD/month | City condo 2BR rent Q4 archive CAD/month | Toronto CPI 2002=100 |
|---|---|---|---|---|
| 2016 | $731,927 | $1,327 | $2,567 | 131.0 |
| 2017 | $823,422 | $1,404 | $2,795 | 133.7 |
| 2018 | $784,118 | $1,467 | $2,944 | 137.1 |
| 2019 | $812,989 | $1,562 | $3,000 | 139.9 |
| 2020 | $926,340 | $1,635 | $2,538 | 140.3 |
| 2021 | $1,098,088 | $1,679 | $2,862 | 144.3 |
| 2022 | $1,193,766 | $1,779 | $3,323 | 153.7 |
| 2023 | $1,131,219 | $1,961 | $3,415 | 160.2 |
| 2024 | $1,120,241 | $1,974 | $3,273 | 164.7 |
| 2025 | $1,067,741 | $2,046 | $3,158 | 167.7 |
3. What each series measures
Regional home prices. We transcribed the annual average prices and sales counts from page 27 of TRREB’s August 2026 Market Watch. The 2016–2024 values come from its historical annual table and 2025 from its annual total. These are transaction averages, not an index that holds dwelling characteristics constant. Changing sales composition can affect the average. TRREB’s explanation of the MLS Home Price Index describes a different, attribute-based measure; we do not label the average-price series as HPI.
Purpose-built rents. The CMHC series is the Toronto CMA average for two-bedroom rental apartments, filtered to Apartment and October. It combines vacant and occupied units, rather than measuring only advertised vacancies or only established tenancies. The selected observations all carry CMHC’s “a” reliability code, meaning excellent. This does not provide confidence intervals for our derived comparisons.
Condominium leases. The City of Toronto series comes from the Apartments table on page 2 of each TRREB fourth-quarter rental report, 2016–2025. It describes recorded two-bedroom condominium lease transactions, rather than the complete stock of Toronto rental homes. It is an as-published archive panel, with each year retaining its own report vintage.
Inflation. We use the annual all-items Toronto CPI from Statistics Canada Table 18-10-0005-01, vector v41695186, on its published 2002=100 base. The source identifies Toronto with 2011 geography, DGUID 2011S0503535. It supplies a common purchasing-power benchmark, not a geographic adjustment between the housing datasets.
4. The decade’s endpoints hide different paths
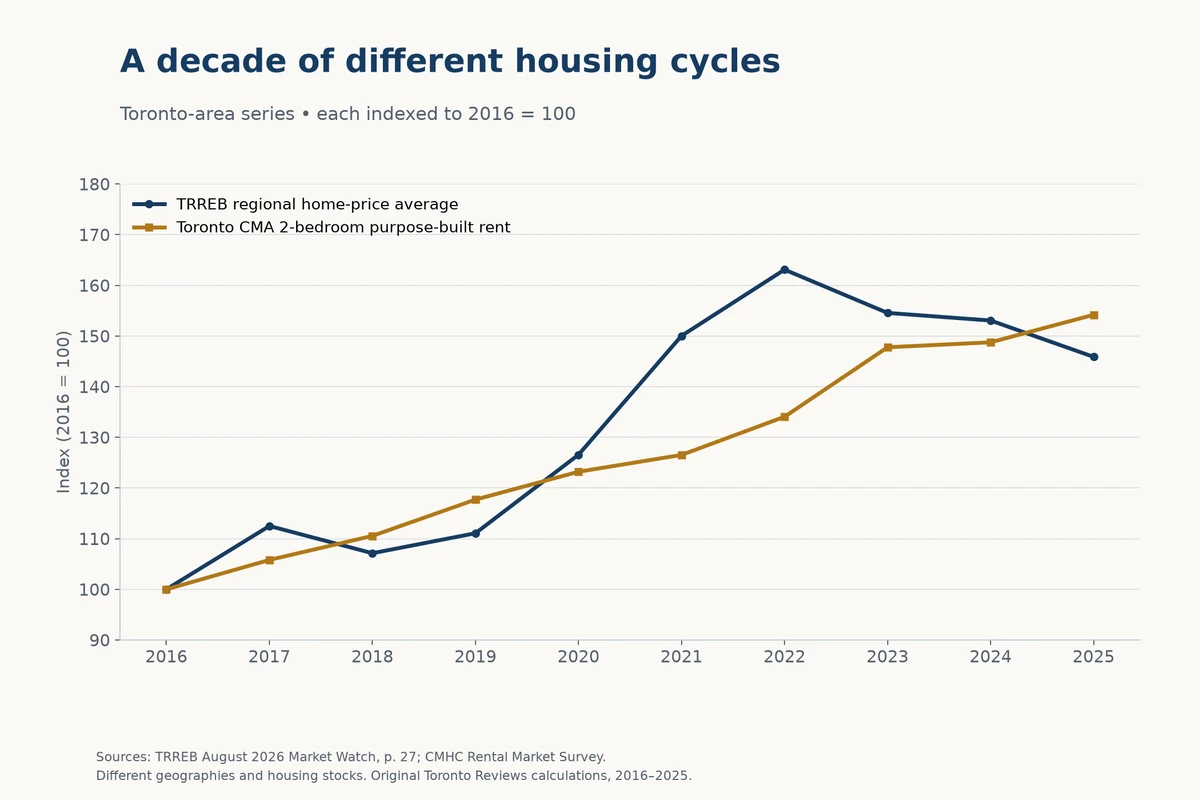
Rebasing each regional series to 100 in 2016 makes the shape of change visible without placing monthly rents and purchase prices on a shared dollar axis. By 2025 the regional home-price index constructed here was 145.9 and the purpose-built rent index was 154.2. Those numbers represent growth within each source population; they do not establish the relative cost of renting and buying the same home.
The home-price path was uneven. The annual average rose 12.5% in 2017, fell 4.8% in 2018, then increased in each of 2019–2022. Its largest annual increase in this window was 18.5% in 2021. The 2022 average of $1,193,766 was the highest annual observation. By 2025 the mean had declined by $126,025 from that level.
The purpose-built rent series rose from $1,327 to $2,046 per month, a $719 increase. Multiplying that endpoint difference by twelve gives an $8,628 annualized difference in the observed average rent level. It is not a measured increase in any particular household’s yearly bill: the survey populations and housing mix can change, and the observations are October snapshots.
The decade’s compound annual growth rates were 4.29% for regional home prices and 4.93% for metropolitan purpose-built rents. There are ten annual observations but only nine elapsed annual intervals. Using ten as the exponent denominator would understate both growth rates.
5. Three equal phases reveal the change in direction
We divide the endpoint interval into three equal three-year spans: 2016–2019, 2019–2022 and 2022–2025. These are descriptive windows selected to cover the study period evenly, not statistically estimated structural breaks. The middle span overlaps the pandemic years, but timing alone does not identify a pandemic effect.
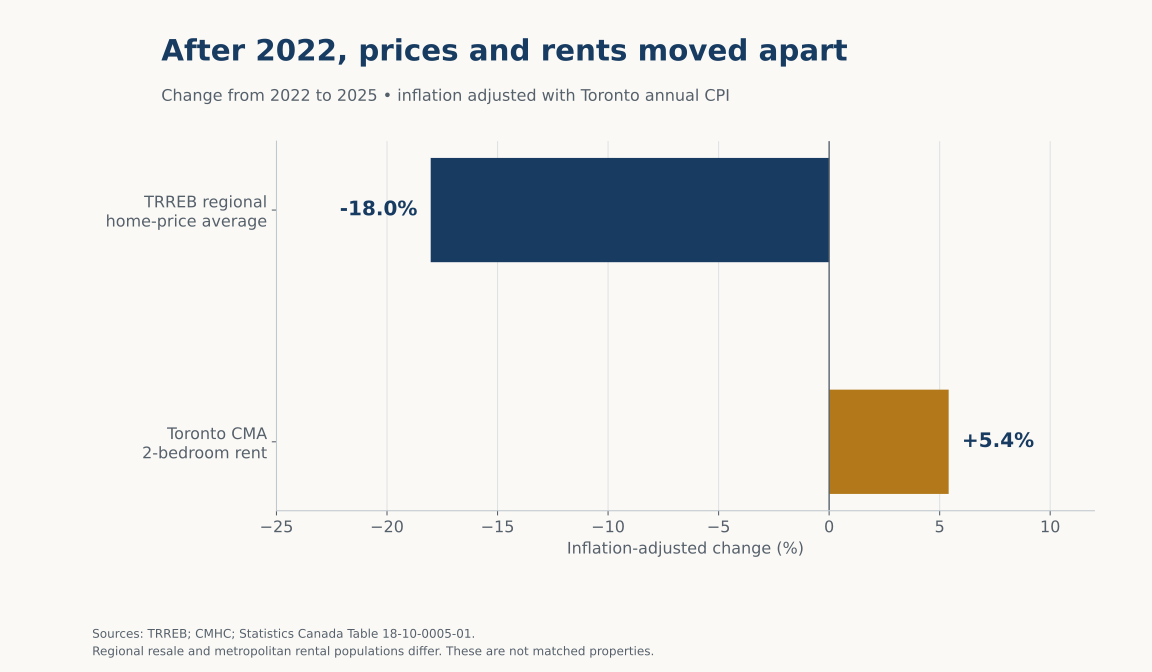
During 2016–2019, the regional home-price average increased 11.1%, while the metropolitan purpose-built rent average increased 17.7%. During 2019–2022, home prices accelerated to a 46.8% increase, compared with 13.9% for the rent average. During 2022–2025, the direction split: home prices declined 10.6% while the rent average increased 15.0%.
This pattern changes the practical meaning of a “housing market recovery” or “housing market correction.” A reduction in the resale average after 2022 did not coincide with a reduction in the purpose-built rent average. Conversely, the exceptional resale increase before 2022 was not mirrored by an equally large increase in the metropolitan rental-stock average.
The phase comparison is more informative than a single cumulative percentage, but it is still descriptive. Interest rates, housing supply, household formation, migration, employment, unit quality and transaction selection are possible influences. We have not estimated their separate contributions and do not assign the observed changes to any one of them.
| Period | Regional home price | CMA 2BR rent | Home price, real | Rent, real |
|---|---|---|---|---|
| 2016–2019 | +11.1% | +17.7% | +4.0% | +10.2% |
| 2019–2022 | +46.8% | +13.9% | +33.7% | +3.7% |
| 2022–2025 | -10.6% | +15.0% | -18.0% | +5.4% |
6. Inflation changes the size of the story
Toronto’s annual all-items CPI increased from 131.0 in 2016 to 167.7 in 2025, a cumulative rise of 28.0%. Dividing housing growth factors by the CPI growth factor leaves a 14.0% real increase in the regional home-price average and a 20.4% real increase in the metropolitan purpose-built rent average over the endpoint interval.
The adjustment is multiplicative. Subtracting 28.0 percentage points from nominal housing growth is not the correct calculation. For example, the rent calculation is (2,046 ÷ 1,327) ÷ (167.7 ÷ 131.0) − 1. The result measures change relative to the chosen consumer-price basket; it is not a household affordability ratio.
The contrast after 2022 is particularly large. On this common inflation basis, the regional annual home-price average declined 18.0% between 2022 and 2025, while the purpose-built rent average increased 5.4%. Expressed in 2025 dollars, the 2022 home-price average was approximately $1.303 million, compared with the actual 2025 average of $1.068 million.
Inflation adjustment also reveals a nuance within the rental series. The nominal purpose-built average was higher in 2025 than in 2023, but its 2023 value expressed in 2025 dollars was about $2,053, slightly above the $2,046 observed in 2025. A new nominal high therefore need not be a new high relative to the consumer-price basket.
We apply annual CPI to annual, October and Q4 housing observations for a consistent broad benchmark. A month-matched or quarter-matched CPI analysis could differ. CPI includes shelter-related expenditure, so the deflator is not an independent explanatory variable and should not be interpreted as a causal adjustment.
7. Toronto condominium leases show a different rental cycle
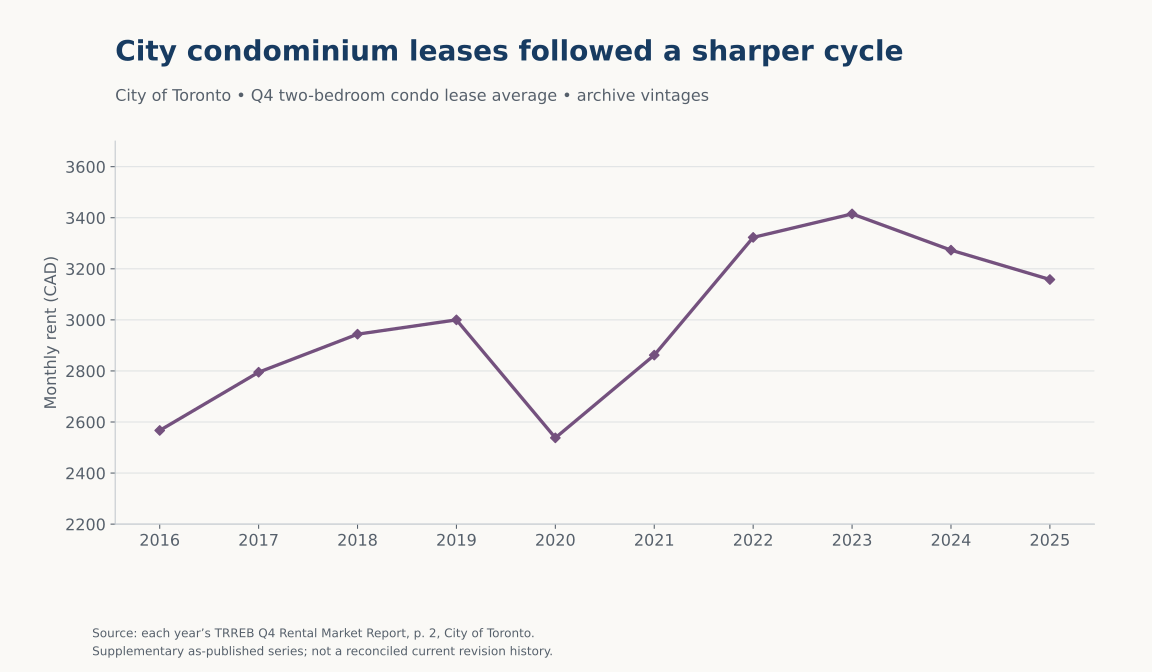
The City of Toronto archive panel gives a useful view of recorded condominium leases. Its Q4 two-bedroom average rose from $2,567 in 2016 to $3,000 in 2019, fell to $2,538 in 2020, recovered to $3,323 in 2022 and reached $3,415 in 2023. The corresponding archived values were $3,273 in 2024 and $3,158 in 2025.
Within that as-published panel, the 2020 decline was 15.4% from the preceding Q4 observation. The 2025 endpoint was 7.5% below the 2023 nominal peak and 23.0% above 2016. These are calculations from archived levels, not a claim to reproduce TRREB’s subsequently revised year-over-year series.
The different pattern is analytically useful: the transaction-based condominium panel fell sharply in 2020, while the purpose-built rental-stock average increased. They track different housing, tenants, boundaries and measurement windows. The comparison demonstrates sensitivity to the choice of rental indicator; it does not measure a causal effect of tenancy protection, a quality premium, or the amount an existing tenant would save by staying put.
In particular, the $1,112 difference between the 2025 city condominium average and metropolitan purpose-built average is not a matched-unit premium. Bedrooms alone do not standardize size, age, location, amenities, utilities, lease timing or tenancy status. We do not use that difference to estimate investment yields or household switching costs.
8. How uneven were the annual movements?
For the two core regional series, we calculate the population standard deviation of the nine successive percentage changes. It was 8.59 percentage points for the home-price average and 2.53 percentage points for the purpose-built rent average. In this observed window, annual movements in the resale average were therefore much more dispersed.
The rent average increased in all nine annual transitions. The home-price average increased in five and declined in four. These are counts of movements in aggregate means, not the proportion of homes gaining value or tenants receiving rent increases.
This dispersion statistic summarizes the selected historical observations; it is not a prediction of future risk or an estimate of the volatility of a specific property. Different sampling windows and a quality-adjusted home-price index could produce different results. With only nine changes, a precise forecasting model, significance claim or causal regression would be difficult to justify.
Transaction volume supplies another caution. The same TRREB table reports 118,084 sales in 2016 and 62,312 in 2025, a 47.2% reduction. The annual means therefore describe differently sized transaction pools. That observation does not tell us how much of the price movement was caused by the changing composition of sales.
9. Revisions, measurement and sensitivity checks
A single publication vintage for the core sale-price history. TRREB’s current Market Watch page warns that historical figures have been updated following the addition of boards to the PropTx MLS system. We therefore take the core regional annual history from one report, August 2026, rather than combining ten first-release annual headlines. That choice establishes a documented snapshot; it does not guarantee that no later revisions will occur.
The December 2025 report initially reported a 2025 annual average of $1,067,968. The August 2026 historical annual total is $1,067,741: $227 lower, or about 0.02%. Substituting that first-release endpoint does not change the direction or substantive interpretation of the results, although some figures rounded to a tenth of a percentage point change. This checks one endpoint revision, not the complete history of revisions.
The condominium panel has a different status. We preserve each year’s archived Q4 city value because a reconciled city-level revision history was not established for this paper. Revisions can be material: the 2024 Q4 report shows a regional two-bedroom rent of $3,154, while the 2025 Q4 report gives $3,288 for its 2024 comparison. That is a different regional figure, not a revised city estimate we can safely substitute. The city archive panel is therefore supplementary, and its changes must not be presented as a current official revised series.
Rental-level changes are not same-sample increases. CMHC distinguishes changes calculated from published average levels from its common-sample rent-growth measure. This paper uses the former. A new or changing sample, different unit mix and turnover can affect the resulting averages. The calculations do not establish the rent increase experienced by a continuing tenant. See CMHC’s survey methodology.
No missing values were imputed. Each included series has an observation for all ten study years. Source reliability codes, units and original values are retained in the CSV and provenance file. Percentage calculations use unrounded inputs; prose rounds most results to one decimal place.
10. Reproducible calculation methods
Let X(t) be a published price or rent level for year t, and C(t) the annual Toronto CPI. Our transformations are:
- Year-over-year change: 100 × [X(t) ÷ X(t−1) − 1]. The first year has no change value within this study and is left blank.
- Index, 2016=100: 100 × X(t) ÷ X(2016). This is our rebased series, not the official MLS HPI.
- Cumulative change: 100 × [X(end) ÷ X(start) − 1].
- Compound annual growth: 100 × [(X(2025) ÷ X(2016))^(1/9) − 1].
- Value in 2025 dollars: X(t) × C(2025) ÷ C(t).
- Real change: 100 × [(X(end) ÷ X(start)) ÷ (C(end) ÷ C(start)) − 1].
- Change from the annual observed peak: 100 × [X(2025) ÷ max(X(2016), …, X(2025)) − 1]. This does not identify a monthly market peak.
- Dispersion of annual changes: the square root of the mean squared deviation of the nine annual percentage changes from their mean, using a denominator of nine.
The phase comparison applies the cumulative and real-change formulas separately to 2016–2019, 2019–2022 and 2022–2025. Adjacent phases share boundary observations. Their percentage changes should be compounded, not added, to recover the complete endpoint change.
No average of monthly averages was substituted for TRREB’s published annual result. No mortgage payment, investment return, capitalization rate, causal coefficient or future price is estimated. The downloadable calculation script recomputes the study’s main results directly from the included observations.
11. What the findings do—and do not—mean for affordability
The results document higher housing-price and rent levels over the decade, including gains relative to a general consumer-price basket. They do not by themselves measure whether households can afford housing. Affordability requires income, taxes, financing terms, down payments, debt obligations and other recurring costs, none of which are observed at the household level here.
For a purchaser, a lower sale price can coexist with a higher financing payment if borrowing terms change. For a renter, the average paid across the purpose-built stock can differ substantially from the listings available during an actual move. Neither the stock average nor the condominium transaction average is a quote for a specific address.
The most useful practical distinction is between market monitoring and a household decision. This tracker supports the first: it identifies historical turning points and puts current discussion in a longer context. The second requires a property-specific budget, current financing information and comparable available homes.
Researchers extending this work should prioritize a common geographic boundary, matched housing types and a consistent revision vintage before calculating a rent-to-price ratio. Adding income and financing data would then support a separate affordability analysis. Without those steps, a precise ratio would disguise more uncertainty than it resolves.
12. Limitations and conclusion
The main limitations are substantive. The housing series cover different boundaries and populations. Annual sale averages, October rental observations and Q4 condominium leases are not fully time-matched. Transaction and sample composition can change. The condominium panel retains archival publication vintages. Aggregate averages cannot describe the distribution across neighbourhoods, income groups or individual homes. Source-level confidence intervals were not carried into these aggregate comparisons, so we do not attach invented uncertainty bands or significance labels.
Even with those limits, the central descriptive conclusion is stable: Toronto-area housing costs followed different cycles. The regional annual home-price average remained well above its 2016 level in 2025, despite three successive annual declines after 2022. The metropolitan purpose-built rent average increased across the entire observed sequence. Inflation reduced the size of the decade’s nominal gains but did not eliminate them for either core series.
The original contribution is not a prediction that either trajectory will continue. It is a transparent record of what changed, when the directions separated, and how the conclusion depends on the definition of rent and the treatment of inflation. A useful Toronto housing tracker must keep those distinctions visible.
Data, sources and research files
The accompanying data package contains the ten annual observations, calculated fields, exact source URLs and table locations, source-file hashes, and a calculation script. The paper and tracker use the same reviewed values. The source providers collected the underlying data; Toronto Reviewer performed the extraction, comparisons and calculations presented here.
Citation suggestion: Toronto Reviewer (2026), Toronto Rent and Home Prices, 2016–2025: A Decade of Diverging Housing Costs, published 16 September 2026. This is an editorial research paper based on public aggregate sources, not a peer-reviewed journal article.
Sources & further reading
Public sources checked September 16, 2026. Confirm current requirements before acting.
- TRREB August 2026 Market Watch — p. 27 annual historical prices and sales
- CMHC — Toronto CMA historical apartment rents, 2016–2025, October
- Statistics Canada — Table 18-10-0005-01, annual Toronto all-items CPI
- CMHC — Rental Market Survey methodology
- TRREB — Market Watch historical revision notice
- TRREB — MLS Home Price Index methodology overview
- TRREB December 2025 Market Watch — first published 2025 annual average
- TRREB Q4 2016 Rental Market Report — p. 2, City of Toronto
- TRREB Q4 2017 Rental Market Report — p. 2, City of Toronto
- TRREB Q4 2018 Rental Market Report — p. 2, City of Toronto
- TRREB Q4 2019 Rental Market Report — p. 2, City of Toronto
- TRREB Q4 2020 Rental Market Report — p. 2, City of Toronto
- TRREB Q4 2021 Rental Market Report — p. 2, City of Toronto
- TRREB Q4 2022 Rental Market Report — p. 2, City of Toronto
- TRREB Q4 2023 Rental Market Report — p. 2, City of Toronto
- TRREB Q4 2024 Rental Market Report — p. 2, City of Toronto
- TRREB Q4 2025 Rental Market Report — p. 2, City of Toronto